You’ve researched your audience. You’ve created mind-blowing content. You’re ready to launch your digital marketing campaign. However, all your efforts will be wasted if you don’t have a robust analytics system in place from the start.
According to Renolon, over half of all websites use Google Analytics which has the largest market share at 30 percent (Statista data) of any analytics platform. This just shows the importance of Google analytics as a platform.
Until 2020, Google’s platform was known as Universal Analytics (UA). This is now being replaced by Google Analytics 4 (GA4) with UA being phased out by 2023. So it’s important to understand what’s changed and make sure your business is already using GA4 to make sure you don’t lose out on data or insights. Read ‘A Guide to GA4 vs Universal Analytics’ to find out everything you need to know.
So let’s find out how you can leverage the power of analytics to maximize revenue and stay ahead of the game.
What is web analytics?
Web analytics involves the collection, measurement, and analysis of website data. Web analytics tools can provide lots of useful information about the origin of website traffic, how website users navigate and interact throughout a website, what content and web pages they're most engaged with, and how they exit the site.
What’s the importance of Google Analytics?
There are many reasons why using analytics tools is a no-brainer for digital marketers today. Here are three of the more important reasons:
It helps you make data-led decisions
Marketers can use the data uncovered by analytics tools to optimize the performance of their channels and websites by taking data-driven decisions.
These are actions we take to improve performance based on our understanding of the data we’ve recorded; that is, the data is leading the decision. For example, if you find out that one of your blogs gets a lot of traffic, optimize the page to get the most out of it by adding pop-ups and including links to other related articles.
Using data is an effective way to use rational thought to improve performance. While it’s best practice to follow data-led decisions, we must always remind ourselves to ‘trust but verify’.
It makes reporting easier
Apart from helping with decision-making, web analytics is an important information source to help marketers report back to key stakeholders on how campaigns and websites are performing in relation to your digital marketing efforts.
Ultimately, marketers are trying to recreate scenarios that lead to commercial outcomes for their organizations or clients. You can do this by measuring and acting on the data trends you observe using web analytics software.
It helps you figure out the ‘story’ behind the data
One of the real values of web data analysis is that it allows you to deduce the ‘story’ behind the data to gain valuable insights and enhance business performance.
But how exactly does this lead to commercial returns? Well, web analytics can help you understand your customers better and see their journey across your channels. It tells you who they are, where they're coming from, and what their interests are. It tells you about their demographics and location. It also helps reveal any conversion challenges that might exist on your website. It helps you appreciate what consumers like or don’t like, and how they interact on your website.
You can use all this information to improve the experience on your site for the consumer and to optimize the channels that consumers use to visit your website.
Web Analytics Tools
There are numerous analytics tools available on the market today. Some of them are free and some require a paid subscription. Paid and free analytics products will differ in terms of support, features, and functionality.
Some examples of analytics packages that are available include:
- Google Analytics and Google Analytics 360, which are part of the Google Marketing Platform
- Adobe Analytics
- Woopra
- Kissmetrics
- Webtrends
- Matomo
What is Google Analytics (GA)?
The market leader and most commonly used analytics program is the free version of Google Analytics or GA as it is sometimes known. The paid version of GA, called Google Analytics 360, offers some additional functionality in terms of report validity and sample sizes. But it's mainly for websites that receive over 10 million page views per month. For the vast majority of websites, the free version of Google Analytics is perfectly fine.
What is Google analytics used for? Because of its functionality and widespread adoption in the market, Google Analytics is seen by many marketers as the single source of truth for website traffic, engagement, and conversion data.
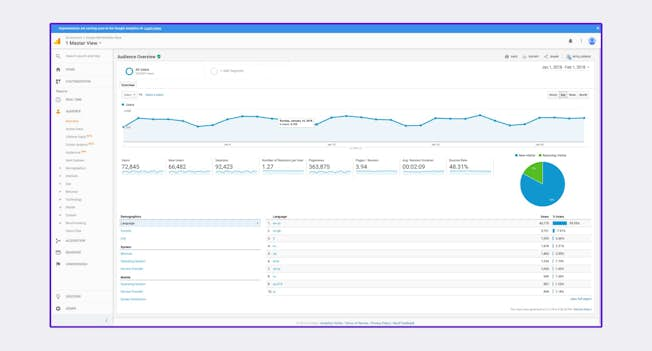
Google Analytics can track the user or consumer journey, providing rich data around channels used, locations, and devices. These journeys can then be tracked through to on-site activity, goals achieved, exit points, as well as returning visitors, which indicates loyalty.
What are the benefits of Google Analytics?
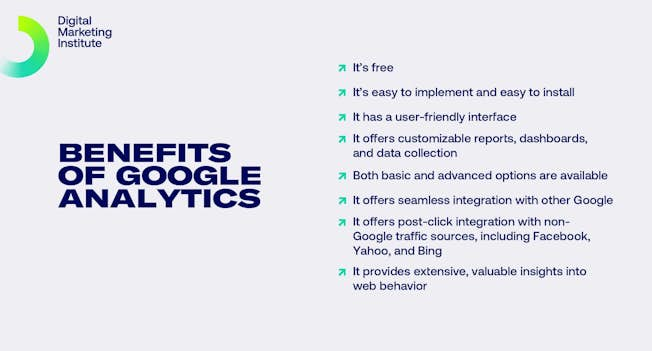
Google Analytics is an excellent choice for most marketing needs. Some benefits of the standard, free version of Google Analytics include:
- It’s free
- It’s easy to implement and install
- It has a user-friendly interface
- It offers customizable reports, dashboards, and data collection
- It offers basic and advanced options
- It offers seamless integration with other Google products
- It offers post-click integration with non-Google traffic sources, including Facebook, Yahoo, and Bing
- It provides extensive, valuable insights into web behavior

Understanding the basic terminology
There are two key concepts underpinning analytics reporting – dimensions and metrics.
Dimensions describe data: things like country, channel, location, age, gender, and device used. Metrics measure data such as visitor numbers, revenue, goal completions, etc.
We segment metrics using dimensions – for example, visits by device type – to get a complete picture. So we can see the total visitor metrics for a website segmented by the device category dimension – i.e desktop, tablet, or mobile users. This allows us to better understand the effectiveness and scale of each device in driving visits and conversions on a website.
Some common dimensions within Google Analytics include:
- Channel Name
- Month
- Country
- Device
Some common engagement metrics within Google Analytics include:
- Sessions
- Users
- Percentage New Sessions or visits
- Page Views
- Pages per Session
- Average Session Duration
You should explore the metrics that are available to you, and see how they can be segmented using dimensions to get a deeper understanding of your website traffic and customers.
What are conversion metrics?
Conversion metrics are an extension of standard visitor metrics. They focus on telling the story behind the valuable actions that users can take on your website. These are generally actions that impact commercial performance, such as revenue totals, conversion rates, etc.
There are some common conversion metrics within Google Analytics. They can all be viewed in the Traffic reports, so you can see how much value each of the different channels is driving. Common conversion metrics include:
- Goals – The number of valuable actions taken on the site, including sales, leads, or downloads
- Conversion Rate – The percentage of visitors that complete a goal
- Transactions – The number of individual sales or shopping basket items sold on an ecommerce website
- Revenue – The monetary value of the ecommerce sales
You can start to determine the value of the campaigns from your different digital marketing channels by looking at the number of goals and transactions from each channel, the conversion rates, and the cost per conversion.
With these three data points, you can decide if a channel is profitable in relation to its time and cost investment.
Read: ‘Google Analytics Goals Guide: How to Set Up And Track Your Bottom-Line KPIs’ to find out more about setting up goals on GA.
Using Google Analytics
So how does Google Analytics work? Now that we’ve covered the background of web analytics tools and why they are useful for marketers and website analytics professionals, you’re now ready to start using GA.

Setting up a Google Analytics account
You can find Google Analytics at www.google.com/analytics/ or analytics.google.com.
Follow these steps to sign up for a GA account:
- To access GA, you will need an email attached to a Google account or your Google Ads login. A Gmail profile is fine.
- To set up your Google Analytics account, add your account information.
- Read and understand the Google Terms of Service.
- Enable data-sharing settings, to link other Google products – Google Ads, Search Console, etc – to GA.
For practice purposes, you can add the GA demo account to your account list via the link: analytics.google.com/analytics/web/demoAccount
How to install the GA tracking code
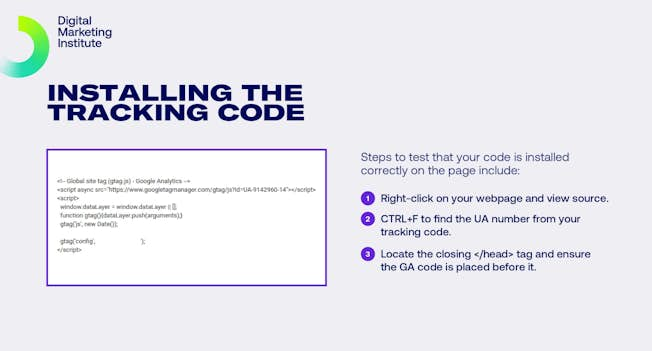
Now you may be wondering how Google tracks users from your website. For this to happen, you need a piece of code to put on your website to send data back to Google Analytics.
This is the UA-code and it is provided during set-up, but it can also be accessed later if required. This code should be given to your web developer to hard code directly onto every page of your website.
However, if you’re an advanced user – and if you use Google Tag Manager – you can add the Google Analytics UA-code into Tag Manager and it will fire the code on all pages of the website.
Keep in mind that testing is essential in all aspects of digital marketing, not least in analytics. So it's important to test to make sure your code is installed correctly and that it’s firing as it should on the website.

How to check the key settings in GA
After you have set up your Google Analytics account, all settings should be checked to ensure the accuracy of your data.
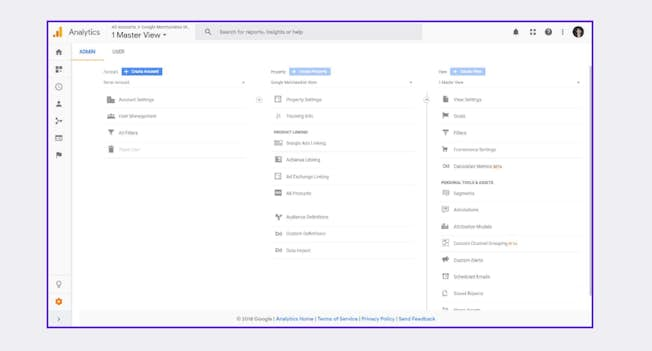
Within Google Analytics, there are three levels within settings – Account, Property, and View – and every item within these levels should be checked. To access these settings, click ‘Admin’, or the cog wheel in the bottom left of the screen.
The account is the highest level within settings and it is the access point for analytics. Within this level are the properties you want to track. There can be many properties within one account. Usually, a website or app would have its own property, so a business with multiple websites could have one account, with a property for each website.
Within the property, you can segment the data into views. A property can have more than one view – usually, there should be a raw view with unfiltered data, as well as a filtered view for main reports.

How to set up GA goals
In GA, conversions are known as ‘goals’. They are the specific, measurable actions that users take on your website. If you want to be able to leverage Google Analytics’ conversion reports, you need to set up, at the very least, a basic goal.
There are four different goal types from which you can choose:
- URL Destination: Whenever a user lands on a “thank you” page or confirmation screen that indicates that they have completed a download or signup.
- Duration: Whenever a user spends a set amount of time on your website.
- Pages/Screens: Whenever a user views a set number of pages during a session.
- Event: When a user takes a certain action, such as playing a video, clicking on an ad, leaving a comment, or downloading a brochure.
If you know how much a particular conversion is worth to your business, you can also set up a goal value, and track how much your conversions are earning.
You can also set up a goal funnel to measure how users move through your website to complete a designated goal. The data is displayed in the Funnel Visualization report.
How to set up a segment in GA
Segments in Google Analytics are used to group site visitors who share common characteristics. They isolate specific types of traffic within your reporting which allows you to interpret your data in a much more efficient manner.
The key benefit of segments is that they provide a temporary filter that can be added and removed and never affect the underlying data. You can add up to four segments at a time and compare the data in your reports.
Analytics offers you the choice between pre-created, or “system” segments, or creating custom segments. Popular Google Analytics segments include:
- By traffic source: is your organic traffic performing better than your paid?
- By visitor type: are new or returning users more likely to convert?
- By location: which cities are the biggest drivers of traffic?
- By demographics: what is the proportion of female customers to males?
- By action taken: which goals are site visitors more likely to complete?
- By content viewed: which pages on your website are the most visited?
If you’re interested in building segments, visit the Analytics Solutions Gallery. This is a platform on which other Analytics users share the segments they’ve created and can provide inspiration that aligns with your specific digital marketing goals.
How can I find out more about my (not provided) keywords?
In 2011, Google announced that when a user visits a website as a result of an organic search, Google Analytics would continue to recognize the traffic as organic search, but the keywords used would no longer be reported.
Thankfully, there are workarounds that you can put into action. Linking your Analytics account to Google Search Console, for example, integrates the data from these two sources and provides you with highly valuable additional reports.
These two data sources are joined via the Landing Page dimension, and combine pre-click data, such as search queries and impressions, with post-click data such as bounce rate and conversions.
Not only does Search Console show you how often your site appears in Google Search results, but the data can also be filtered by some categories, including Search Query. It will also tell you the CTRs of your keywords.
How to organize your GA account
The structure of Google Analytics is based upon a clear, distinct hierarchy that helps digital marketers to organize their accounts, which is important when you consider that you can have up to 50 website properties under one Google Analytics account, and 25 views under one website property!
An account is your main access point for analytics. Within your account, a property is a website, mobile app or device from which you want to collect data. When you add a property to an account, Analytics generates a tracking code that you use to collect data from that property.
A view is where you can access your reports; it’s the defined view of data that relates to a particular property. For example, you can create views of all site data, Google Ads traffic or a subdomain.
The better your account is organized, the quicker and easier it will be to access essential data.
How to collaborate with your team
To collaborate effectively with team members, as well as with external agencies and clients, you need to ensure that everyone is working from the same data source.
To do this, you can grant access to other users within your Google Analytics account, and apply different permission settings. Do this in the User Management section at an Account, Property, or View level.
Linking to other tools
One of the really useful aspects of Google Analytics is its ability to seamlessly link to other Google products and tools so that you can supplement your reports with additional insights.
The main tools available to link to are Google Ads, Google Search Console, and Search Ads 360 (formerly known as DoubleClick by Google).
To link these additional tools, you need to access the product linking section within the Property settings. Each of the available tools for linking is listed there and you simply follow the instructions to link the tools.
Use Google Analytics to Get Actionable Insights
Google Analytics can provide you with a goldmine of data, but it can be overwhelming if you're seeking specific information. DMIs short data and web analytics course will teach you the fundamentals of data and analytics, explore the ins and outs of GA4, cover data security and compliance, and show you how to visualize and present data. Get started today!
(Updated Nov 2022)
Related
- Categories:
- Articles
- Data and Analytics
Upgrade to Power Membership to continue
your access to thousands of articles, toolkits, podcasts, lessons and much much more.
Become a Power Member- Login
- View Courses
- - - -
- Courses
- Resources
- - - -
- My Account
- Change Password
- Logout


